Fairfield City
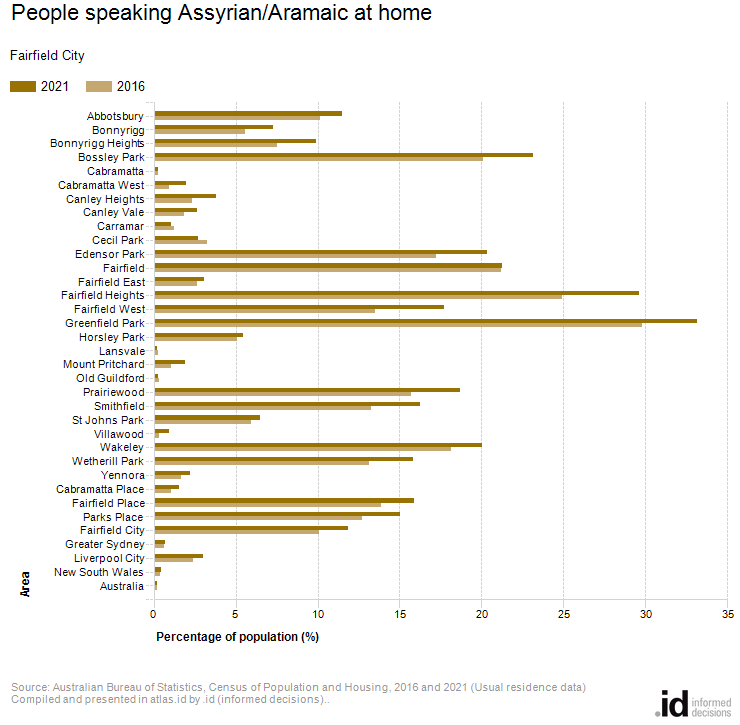
People speaking Assyrian/Aramaic at home
Derived from the Census question:
‘Does the person speak a language other than English at home?’
Total population
In 2021, Greenfield Park had the highest proportion of people speaking Assyrian/Aramaic at home in Fairfield City.
This data includes all persons who speak Assyrian/Aramaic at home as their main language, (regardless of where they were born).
In Fairfield City, Assyrian/Aramaic speakers are a significant sized population. Understanding the distribution of this group is important for the delivery of cultural, community and language services.
| People speaking Assyrian/Aramaic at home | ||||||||||
|---|---|---|---|---|---|---|---|---|---|---|
| Fairfield City - Usual residence | 2021 | 2016 | Change | |||||||
| Area | Number | Total population | Percent % | Number | Total population | Percent % | 2016 to 2021 | |||
| 100 | Abbotsbury | 482 | 4,194 | 11.5 | 432 | 4,251 | 10.2 | +50 | 100100 | 2021 |
| 110 | Bonnyrigg | 714 | 9,788 | 7.3 | 484 | 8,670 | 5.6 | +230 | 100110 | 2021 |
| 120 | Bonnyrigg Heights | 732 | 7,370 | 9.9 | 551 | 7,305 | 7.5 | +181 | 100120 | 2021 |
| 130 | Bossley Park | 3,581 | 15,488 | 23.1 | 2,929 | 14,580 | 20.1 | +652 | 100130 | 2021 |
| 140 | Cabramatta | 51 | 21,136 | 0.2 | 63 | 21,784 | 0.3 | -12 | 100140 | 2021 |
| 150 | Cabramatta West | 155 | 7,829 | 2.0 | 67 | 7,220 | 0.9 | +88 | 100150 | 2021 |
| 160 | Canley Heights | 466 | 12,321 | 3.8 | 260 | 10,973 | 2.4 | +206 | 100160 | 2021 |
| 170 | Canley Vale | 272 | 10,294 | 2.6 | 188 | 10,215 | 1.8 | +84 | 100170 | 2021 |
| 180 | Carramar | 37 | 3,471 | 1.1 | 44 | 3,551 | 1.2 | -7 | 100180 | 2021 |
| 190 | Cecil Park | 22 | 816 | 2.7 | 25 | 772 | 3.2 | -3 | 100190 | 2021 |
| 200 | Edensor Park | 2,085 | 10,261 | 20.3 | 1,684 | 9,772 | 17.2 | +401 | 100200 | 2021 |
| 210 | Fairfield | 3,915 | 18,431 | 21.2 | 3,798 | 17,900 | 21.2 | +117 | 100210 | 2021 |
| 220 | Fairfield East | 160 | 5,207 | 3.1 | 142 | 5,341 | 2.7 | +18 | 100220 | 2021 |
| 230 | Fairfield Heights | 2,447 | 8,266 | 29.6 | 1,874 | 7,517 | 24.9 | +573 | 100230 | 2021 |
| 240 | Fairfield West | 2,296 | 12,967 | 17.7 | 1,564 | 11,571 | 13.5 | +732 | 100240 | 2021 |
| 250 | Greenfield Park | 1,791 | 5,401 | 33.2 | 1,515 | 5,088 | 29.8 | +276 | 100250 | 2021 |
| 260 | Horsley Park | 97 | 1,783 | 5.4 | 94 | 1,837 | 5.1 | +3 | 100260 | 2021 |
| 270 | Lansvale | 6 | 2,602 | 0.2 | 7 | 2,575 | 0.3 | -1 | 100270 | 2021 |
| 280 | Mount Pritchard | 186 | 9,861 | 1.9 | 102 | 9,494 | 1.1 | +84 | 100280 | 2021 |
| 290 | Old Guildford | 8 | 2,849 | 0.3 | 8 | 2,663 | 0.3 | 0 | 100290 | 2021 |
| 300 | Prairiewood | 647 | 3,466 | 18.7 | 509 | 3,242 | 15.7 | +138 | 100300 | 2021 |
| 310 | Smithfield | 2,139 | 13,150 | 16.3 | 1,586 | 11,977 | 13.2 | +553 | 100310 | 2021 |
| 320 | St Johns Park | 407 | 6,299 | 6.5 | 365 | 6,118 | 6.0 | +42 | 100320 | 2021 |
| 330 | Villawood | 21 | 2,175 | 1.0 | 6 | 2,013 | 0.3 | +15 | 100330 | 2021 |
| 340 | Wakeley | 981 | 4,891 | 20.1 | 860 | 4,745 | 18.1 | +121 | 100340 | 2021 |
| 350 | Wetherill Park | 1,015 | 6,405 | 15.8 | 804 | 6,126 | 13.1 | +211 | 100350 | 2021 |
| 360 | Yennora | 37 | 1,680 | 2.2 | 27 | 1,619 | 1.7 | +10 | 100360 | 2021 |
| 370 | Cabramatta Place | 795 | 52,058 | 1.5 | 529 | 50,779 | 1.0 | +266 | 100370 | 2021 |
| 380 | Fairfield Place | 9,083 | 57,222 | 15.9 | 7,552 | 54,437 | 13.9 | +1,531 | 100380 | 2021 |
| 390 | Parks Place | 14,883 | 99,205 | 15.0 | 11,925 | 93,967 | 12.7 | +2,958 | 100390 | 2021 |
| 10 | Fairfield City | 24,762 | 208,476 | 11.9 | 20,030 | 198,817 | 10.1 | +4,732 | 200010 | 2021 |
| 20 | Greater Sydney | 37,814 | 5,231,146 | 0.7 | 29,556 | 4,823,991 | 0.6 | +8,258 | 300020 | 2021 |
| 35 | Liverpool City | 7,096 | 233,442 | 3.0 | 4,972 | 204,326 | 2.4 | +2,124 | 300035 | 2021 |
| 40 | New South Wales | 38,075 | 8,072,164 | 0.5 | 29,744 | 7,480,228 | 0.4 | +8,331 | 300040 | 2021 |
| 50 | Australia | 60,309 | 25,422,816 | 0.2 | 45,690 | 23,401,890 | 0.2 | +14,619 | 300050 | 2021 |
Source: Australian Bureau of Statistics, Census of Population and Housing (opens a new window) 2016 and 2021. Compiled and presented in atlas.id by .id (opens a new window)(informed decisions).
Compiled and presented in atlas.id by .id (informed decisions)..
Analysis
In 2021, 11.9% of Fairfield City's population spoke Assyrian/Aramaic at home compared to 0.7% in Greater Sydney.
While Fairfield City had a higher proportion of people who spoke Assyrian/Aramaic at home, it is important to note that this varied across the City. Proportions ranged from a low of 0.2% in Lansvale to a high of 33.2% in Greenfield Park. The five areas with the highest percentages were:
- Greenfield Park (33.2%)
- Fairfield Heights (29.6%)
- Bossley Park (23.1%)
- Fairfield (21.2%)
- Edensor Park (20.3%)
Data notes
This data includes all persons who speak Assyrian/Aramaic at home, as their main language. It is independent of birthplace, and may include second generation migrants. It does not indicate people who speak multiple languages, but is more a measure of "native" or "first" language.