City of Greater Geelong
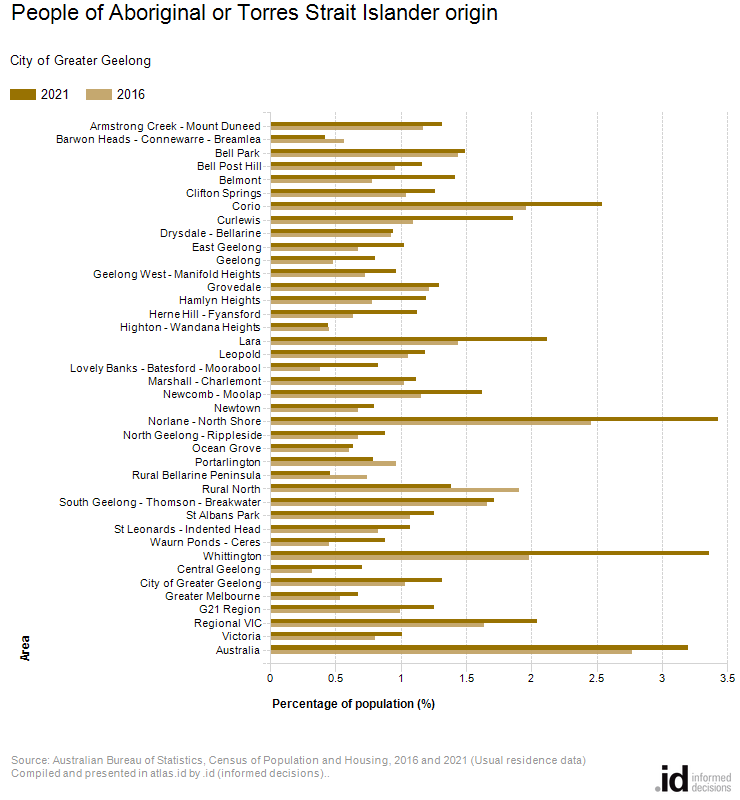
People of Aboriginal or Torres Strait Islander origin
Derived from the Census question:
‘Is the person of Aboriginal or Torres Strait Islander origin?’
Total population
In 2021, Norlane - North Shore had the highest proportion of Aboriginal or Torres Strait Islander population in the City of Greater Geelong.
Indigenous Australians include people identifying as Aboriginal, Torres Strait Islander and persons who are of both Aboriginal and Torres Strait Islander origin. This group collectively are also often known as First Nations.
| People of Aboriginal or Torres Strait Islander origin | ||||||||||
|---|---|---|---|---|---|---|---|---|---|---|
| City of Greater Geelong - Usual residence | 2021 | 2016 | Change | |||||||
| Area | Number | Total population | Percent % | Number | Total population | Percent % | 2016 to 2021 | |||
| 100 | Armstrong Creek - Mount Duneed | 224 | 17,004 | 1.3 | 64 | 5,432 | 1.2 | +160 | 100100 | 2021 |
| 110 | Barwon Heads - Connewarre - Breamlea | 22 | 5,241 | 0.4 | 26 | 4,554 | 0.6 | -4 | 100110 | 2021 |
| 120 | Bell Park | 84 | 5,615 | 1.5 | 72 | 5,013 | 1.4 | +12 | 100120 | 2021 |
| 130 | Bell Post Hill | 59 | 5,084 | 1.2 | 47 | 4,914 | 1.0 | +12 | 100130 | 2021 |
| 140 | Belmont | 213 | 15,060 | 1.4 | 110 | 14,048 | 0.8 | +103 | 100140 | 2021 |
| 150 | Clifton Springs | 96 | 7,612 | 1.3 | 78 | 7,521 | 1.0 | +18 | 100150 | 2021 |
| 160 | Corio | 394 | 15,487 | 2.5 | 300 | 15,292 | 2.0 | +94 | 100160 | 2021 |
| 170 | Curlewis | 77 | 4,142 | 1.9 | 17 | 1,557 | 1.1 | +60 | 100170 | 2021 |
| 180 | Drysdale - Bellarine | 49 | 5,217 | 0.9 | 41 | 4,441 | 0.9 | +8 | 100180 | 2021 |
| 190 | East Geelong | 41 | 4,010 | 1.0 | 26 | 3,865 | 0.7 | +15 | 100190 | 2021 |
| 200 | Geelong | 51 | 6,375 | 0.8 | 28 | 5,769 | 0.5 | +23 | 100200 | 2021 |
| 210 | Geelong West - Manifold Heights | 97 | 10,023 | 1.0 | 70 | 9,617 | 0.7 | +27 | 100210 | 2021 |
| 220 | Grovedale | 192 | 14,862 | 1.3 | 174 | 14,311 | 1.2 | +18 | 100220 | 2021 |
| 230 | Hamlyn Heights | 78 | 6,514 | 1.2 | 49 | 6,292 | 0.8 | +29 | 100230 | 2021 |
| 240 | Herne Hill - Fyansford | 53 | 4,712 | 1.1 | 23 | 3,605 | 0.6 | +30 | 100240 | 2021 |
| 250 | Highton - Wandana Heights | 101 | 22,937 | 0.4 | 94 | 20,991 | 0.4 | +7 | 100250 | 2021 |
| 260 | Lara | 402 | 18,995 | 2.1 | 235 | 16,358 | 1.4 | +167 | 100260 | 2021 |
| 270 | Leopold | 157 | 13,270 | 1.2 | 135 | 12,814 | 1.1 | +22 | 100270 | 2021 |
| 280 | Lovely Banks - Batesford - Moorabool | 26 | 3,152 | 0.8 | 10 | 2,638 | 0.4 | +16 | 100280 | 2021 |
| 290 | Marshall - Charlemont | 55 | 4,916 | 1.1 | 23 | 2,243 | 1.0 | +32 | 100290 | 2021 |
| 300 | Newcomb - Moolap | 106 | 6,534 | 1.6 | 68 | 5,874 | 1.2 | +38 | 100300 | 2021 |
| 310 | Newtown | 83 | 10,441 | 0.8 | 68 | 10,148 | 0.7 | +15 | 100310 | 2021 |
| 320 | Norlane - North Shore | 309 | 9,008 | 3.4 | 213 | 8,669 | 2.5 | +96 | 100320 | 2021 |
| 330 | North Geelong - Rippleside | 37 | 4,222 | 0.9 | 26 | 3,843 | 0.7 | +11 | 100330 | 2021 |
| 340 | Ocean Grove | 113 | 17,713 | 0.6 | 86 | 14,161 | 0.6 | +27 | 100340 | 2021 |
| 350 | Portarlington | 35 | 4,437 | 0.8 | 35 | 3,619 | 1.0 | 0 | 100350 | 2021 |
| 360 | Rural Bellarine Peninsula | 18 | 3,906 | 0.5 | 21 | 2,806 | 0.7 | -3 | 100360 | 2021 |
| 370 | Rural North | 25 | 1,802 | 1.4 | 33 | 1,734 | 1.9 | -8 | 100370 | 2021 |
| 380 | South Geelong - Thomson - Breakwater | 63 | 3,679 | 1.7 | 60 | 3,619 | 1.7 | +3 | 100380 | 2021 |
| 390 | St Albans Park | 62 | 4,950 | 1.3 | 52 | 4,846 | 1.1 | +10 | 100390 | 2021 |
| 400 | St Leonards - Indented Head | 53 | 4,930 | 1.1 | 30 | 3,615 | 0.8 | +23 | 100400 | 2021 |
| 410 | Waurn Ponds - Ceres | 46 | 5,232 | 0.9 | 24 | 5,305 | 0.5 | +22 | 100410 | 2021 |
| 420 | Whittington | 134 | 3,990 | 3.4 | 77 | 3,879 | 2.0 | +57 | 100420 | 2021 |
| 430 | Central Geelong | 14 | 1,993 | 0.7 | 5 | 1,464 | 0.3 | +9 | 100430 | 2021 |
| 10 | City of Greater Geelong | 3,562 | 271,051 | 1.3 | 2,407 | 233,429 | 1.0 | +1,155 | 200010 | 2021 |
| 20 | Greater Melbourne | 32,951 | 4,917,755 | 0.7 | 24,064 | 4,485,211 | 0.5 | +8,887 | 300020 | 2021 |
| 25 | G21 Region | 4,503 | 359,436 | 1.3 | 3,072 | 308,339 | 1.0 | +1,431 | 300025 | 2021 |
| 30 | Regional VIC | 32,238 | 1,576,614 | 2.0 | 23,444 | 1,433,818 | 1.6 | +8,794 | 300030 | 2021 |
| 40 | Victoria | 65,640 | 6,503,495 | 1.0 | 47,788 | 5,926,624 | 0.8 | +17,852 | 300040 | 2021 |
| 50 | Australia | 812,708 | 25,422,816 | 3.2 | 649,170 | 23,401,890 | 2.8 | +163,538 | 300050 | 2021 |
Source: Australian Bureau of Statistics, Census of Population and Housing (opens a new window) 2016 and 2021. Compiled and presented in atlas.id by .id (opens a new window)(informed decisions).
Compiled and presented in atlas.id by .id (informed decisions)..
Analysis
In 2021, 1.3% of the City of Greater Geelong's population was of Aboriginal and/or Torres Strait Islander origin compared to 0.7% in Greater Melbourne.
While the City of Greater Geelong had a higher proportion of Aboriginal and Torres Strait Islanders, it is important to note that this varied across the Region. Proportions ranged from a low of 0.4% in Barwon Heads - Connewarre - Breamlea to a high of 3.4% in Norlane - North Shore. The five areas with the highest percentages were:
- Norlane - North Shore (3.4%)
- Whittington (3.4%)
- Corio (2.5%)
- Lara (2.1%)
- Curlewis (1.9%)
Data notes
This dataset includes all persons of Aboriginal or Torres Strait Islander origin - persons who answered Question 11 on the 2021 Census form (or equivalent from earlier Censuses) "Is the person of Aboriginal or Torres Strait Islander origin?" with either "Yes, Aboriginal", "Yes, Torres Strait Islander", or both. It is not derived from the Ancestry question on the form.