City of Sydney
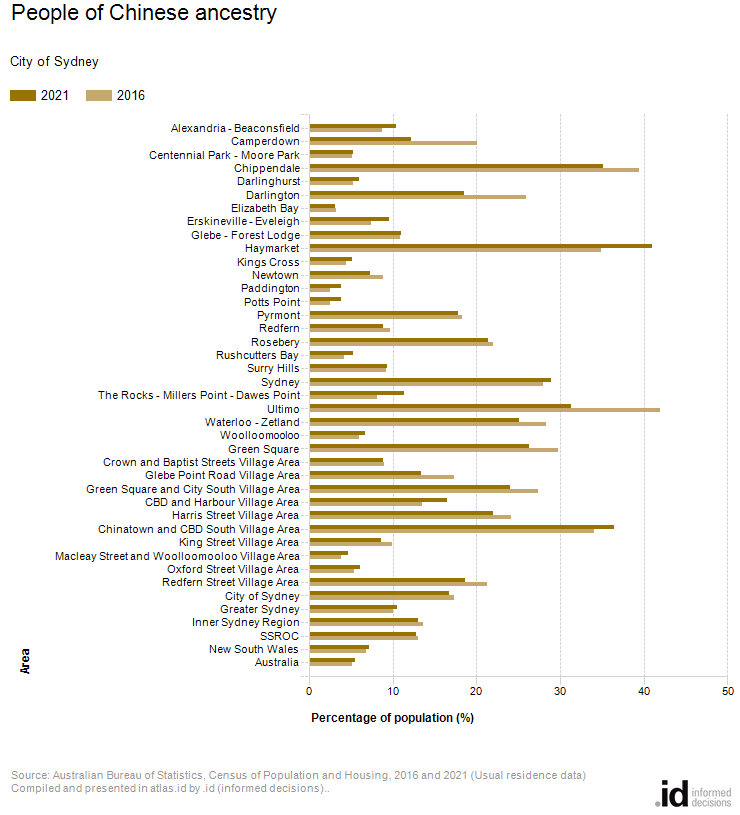
People of Chinese ancestry
Derived from the question:
'What is the person's ancestry?'.
Total population
In 2021, Haymarket had the highest proportion of people with Chinese ancestry in the City of Sydney.
This dataset includes all persons in the City of Sydney who nominated Chinese as one of their ancestries. Respondents are advised to go back up to 3 generations, but responses may still be subjective. Ancestry is a good way of measuring cultural groups who are not well defined by a birthplace or language spoken and can indicate the broad size of a particular community within the area.
| People of Chinese ancestry | ||||||||||
|---|---|---|---|---|---|---|---|---|---|---|
| City of Sydney - Usual residence | 2021 | 2016 | Change | |||||||
| Area | Number | Total population | Percent % | Number | Total population | Percent % | 2016 to 2021 | |||
| 105 | Alexandria - Beaconsfield | 1,128 | 10,820 | 10.4 | 807 | 9,255 | 8.7 | +321 | 100105 | 2021 |
| 110 | Camperdown | 735 | 6,049 | 12.2 | 1,362 | 6,788 | 20.1 | -627 | 100110 | 2021 |
| 120 | Centennial Park - Moore Park | 118 | 2,255 | 5.2 | 124 | 2,389 | 5.2 | -6 | 100120 | 2021 |
| 130 | Chippendale | 2,737 | 7,800 | 35.1 | 3,403 | 8,615 | 39.5 | -666 | 100130 | 2021 |
| 140 | Darlinghurst | 636 | 10,609 | 6.0 | 599 | 11,317 | 5.3 | +37 | 100140 | 2021 |
| 150 | Darlington | 482 | 2,596 | 18.6 | 802 | 3,093 | 25.9 | -320 | 100150 | 2021 |
| 160 | Elizabeth Bay | 131 | 4,137 | 3.2 | 145 | 4,402 | 3.3 | -14 | 100160 | 2021 |
| 170 | Erskineville - Eveleigh | 983 | 10,265 | 9.6 | 640 | 8,680 | 7.4 | +343 | 100170 | 2021 |
| 180 | Glebe - Forest Lodge | 1,836 | 16,640 | 11.0 | 1,748 | 16,117 | 10.8 | +88 | 100180 | 2021 |
| 190 | Haymarket | 3,403 | 8,307 | 41.0 | 2,563 | 7,354 | 34.9 | +840 | 100190 | 2021 |
| 200 | Kings Cross | 218 | 4,252 | 5.1 | 191 | 4,295 | 4.4 | +27 | 100200 | 2021 |
| 210 | Newtown | 494 | 6,754 | 7.3 | 637 | 7,232 | 8.8 | -143 | 100210 | 2021 |
| 220 | Paddington | 109 | 2,822 | 3.9 | 73 | 2,926 | 2.5 | +36 | 100220 | 2021 |
| 230 | Potts Point | 166 | 4,297 | 3.9 | 162 | 6,534 | 2.5 | +4 | 100230 | 2021 |
| 240 | Pyrmont | 2,253 | 12,658 | 17.8 | 2,342 | 12,813 | 18.3 | -89 | 100240 | 2021 |
| 250 | Redfern | 1,165 | 13,065 | 8.9 | 1,276 | 13,213 | 9.7 | -111 | 100250 | 2021 |
| 260 | Rosebery | 2,334 | 10,931 | 21.4 | 1,612 | 7,330 | 22.0 | +722 | 100260 | 2021 |
| 270 | Rushcutters Bay | 92 | 1,728 | 5.3 | 83 | 1,960 | 4.2 | +9 | 100270 | 2021 |
| 280 | Surry Hills | 1,488 | 15,835 | 9.4 | 1,509 | 16,416 | 9.2 | -21 | 100280 | 2021 |
| 290 | Sydney | 4,881 | 16,851 | 29.0 | 4,883 | 17,442 | 28.0 | -2 | 100290 | 2021 |
| 300 | The Rocks - Millers Point - Dawes Point | 317 | 2,787 | 11.4 | 213 | 2,621 | 8.1 | +104 | 100300 | 2021 |
| 310 | Ultimo | 2,328 | 7,423 | 31.4 | 3,711 | 8,846 | 42.0 | -1,383 | 100310 | 2021 |
| 320 | Waterloo - Zetland | 7,277 | 28,989 | 25.1 | 6,999 | 24,693 | 28.3 | +278 | 100320 | 2021 |
| 330 | Woolloomooloo | 255 | 3,796 | 6.7 | 238 | 4,007 | 5.9 | +17 | 100330 | 2021 |
| 340 | Green Square | 8,871 | 33,748 | 26.3 | 7,432 | 24,947 | 29.8 | +1,439 | 100340 | 2021 |
| 350 | Crown and Baptist Streets Village Area | 1,845 | 20,813 | 8.9 | 1,899 | 21,209 | 9.0 | -54 | 100350 | 2021 |
| 360 | Glebe Point Road Village Area | 3,033 | 22,623 | 13.4 | 3,948 | 22,683 | 17.4 | -915 | 100360 | 2021 |
| 370 | Green Square and City South Village Area | 9,652 | 40,138 | 24.0 | 8,378 | 30,635 | 27.3 | +1,274 | 100370 | 2021 |
| 380 | CBD and Harbour Village Area | 1,323 | 8,007 | 16.5 | 1,088 | 8,042 | 13.5 | +235 | 100380 | 2021 |
| 390 | Harris Street Village Area | 3,894 | 17,718 | 22.0 | 4,492 | 18,611 | 24.1 | -598 | 100390 | 2021 |
| 400 | Chinatown and CBD South Village Area | 7,281 | 19,946 | 36.5 | 6,604 | 19,380 | 34.1 | +677 | 100400 | 2021 |
| 410 | King Street Village Area | 1,834 | 21,149 | 8.7 | 2,052 | 20,615 | 10.0 | -218 | 100410 | 2021 |
| 420 | Macleay Street and Woolloomooloo Village Area | 842 | 17,980 | 4.7 | 819 | 20,989 | 3.9 | +24 | 100420 | 2021 |
| 430 | Oxford Street Village Area | 1,085 | 17,643 | 6.1 | 1,026 | 18,826 | 5.5 | +59 | 100430 | 2021 |
| 440 | Redfern Street Village Area | 4,775 | 25,653 | 18.6 | 5,826 | 27,394 | 21.3 | -1,051 | 100440 | 2021 |
| 10 | City of Sydney | 35,572 | 211,645 | 16.8 | 36,177 | 208,374 | 17.4 | -605 | 200010 | 2021 |
| 20 | Greater Sydney | 552,808 | 5,231,146 | 10.6 | 488,102 | 4,823,991 | 10.1 | +64,706 | 300020 | 2021 |
| 25 | Inner Sydney Region | 107,752 | 825,829 | 13.0 | 111,064 | 817,265 | 13.6 | -3,312 | 300025 | 2021 |
| 30 | SSROC | 225,477 | 1,754,478 | 12.9 | 220,376 | 1,684,930 | 13.1 | +5,101 | 300030 | 2021 |
| 40 | New South Wales | 581,788 | 8,072,164 | 7.2 | 514,739 | 7,480,228 | 6.9 | +67,049 | 300040 | 2021 |
| 50 | Australia | 1,391,251 | 25,422,816 | 5.5 | 1,214,438 | 23,401,890 | 5.2 | +176,813 | 300050 | 2021 |
Source: Australian Bureau of Statistics, Census of Population and Housing (opens a new window) 2016 and 2021. Compiled and presented in atlas.id by .id (opens a new window)(informed decisions).
Compiled and presented in atlas.id by .id (informed decisions)..
Analysis
In 2021, 16.8% of the City of Sydney's population nominated Chinese as one of their ancestries compared to 10.6% in Greater Sydney.
While the City of Sydney had a relatively higher proportion of people with Chinese descent, it is important to note that this varied across the City. Proportions ranged from a low of 3.2% in Elizabeth Bay to a high of 41.0% in Haymarket. The five areas with the highest percentages were:
- Haymarket (41.0%)
- Chinatown and CBD South Village Area (36.5%)
- Chippendale (35.1%)
- Ultimo (31.4%)
- Sydney (29.0%)
Data notes
This data includes all persons who nominated Chinese as one of their ancestries on the Census form. Ancestry is a more subjective measure than birthplace or language but can provide a good indication of the size of particular communities. Please note that individuals may be counted in more than one Ancestry map, since it is a multi-response variable. Percentages are calculated from the total population, not the total responses.