City of Whitehorse
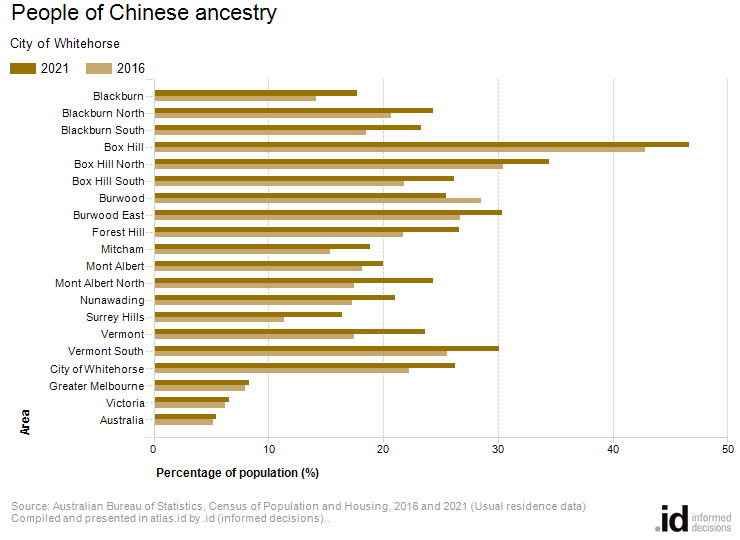
People of Chinese ancestry
Derived from the question:
'What is the person's ancestry?'.
Total population
In 2021, Box Hill had the highest proportion of people with Chinese ancestry in the City of Whitehorse.
This dataset includes all persons in the City of Whitehorse who nominated Chinese as one of their ancestries. Respondents are advised to go back up to 3 generations, but responses may still be subjective. Ancestry is a good way of measuring cultural groups who are not well defined by a birthplace or language spoken and can indicate the broad size of a particular community within the area.
| People of Chinese ancestry | ||||||||||
|---|---|---|---|---|---|---|---|---|---|---|
| City of Whitehorse - Usual residence | 2021 | 2016 | Change | |||||||
| Area | Number | Total population | Percent % | Number | Total population | Percent % | 2016 to 2021 | |||
| 100 | Blackburn | 2,566 | 14,465 | 17.7 | 1,972 | 13,943 | 14.1 | +594 | 100100 | 2021 |
| 110 | Blackburn North | 1,856 | 7,624 | 24.3 | 1,542 | 7,439 | 20.7 | +314 | 100110 | 2021 |
| 120 | Blackburn South | 2,550 | 10,937 | 23.3 | 1,994 | 10,793 | 18.5 | +556 | 100120 | 2021 |
| 130 | Box Hill | 6,690 | 14,344 | 46.6 | 4,876 | 11,390 | 42.8 | +1,814 | 100130 | 2021 |
| 140 | Box Hill North | 4,258 | 12,346 | 34.5 | 3,619 | 11,871 | 30.5 | +639 | 100140 | 2021 |
| 150 | Box Hill South | 2,223 | 8,496 | 26.2 | 1,842 | 8,437 | 21.8 | +381 | 100150 | 2021 |
| 160 | Burwood | 3,143 | 12,345 | 25.5 | 3,491 | 12,248 | 28.5 | -348 | 100160 | 2021 |
| 170 | Burwood East | 3,243 | 10,677 | 30.4 | 2,742 | 10,273 | 26.7 | +501 | 100170 | 2021 |
| 180 | Forest Hill | 2,870 | 10,781 | 26.6 | 2,305 | 10,626 | 21.7 | +565 | 100180 | 2021 |
| 190 | Mitcham | 3,166 | 16,784 | 18.9 | 2,477 | 16,148 | 15.3 | +689 | 100190 | 2021 |
| 200 | Mont Albert | 959 | 4,807 | 20.0 | 862 | 4,753 | 18.1 | +97 | 100200 | 2021 |
| 210 | Mont Albert North | 1,409 | 5,792 | 24.3 | 991 | 5,678 | 17.5 | +418 | 100210 | 2021 |
| 220 | Nunawading | 2,549 | 12,097 | 21.1 | 1,988 | 11,520 | 17.3 | +561 | 100220 | 2021 |
| 230 | Surrey Hills | 881 | 5,363 | 16.4 | 600 | 5,274 | 11.4 | +281 | 100230 | 2021 |
| 240 | Vermont | 2,490 | 10,527 | 23.7 | 1,749 | 10,024 | 17.4 | +741 | 100240 | 2021 |
| 250 | Vermont South | 3,599 | 11,960 | 30.1 | 2,981 | 11,678 | 25.5 | +618 | 100250 | 2021 |
| 10 | City of Whitehorse | 44,445 | 169,344 | 26.2 | 36,029 | 162,078 | 22.2 | +8,416 | 200010 | 2021 |
| 20 | Greater Melbourne | 409,519 | 4,917,755 | 8.3 | 356,530 | 4,485,211 | 7.9 | +52,989 | 300020 | 2021 |
| 40 | Victoria | 427,716 | 6,503,495 | 6.6 | 370,861 | 5,926,624 | 6.3 | +56,855 | 300040 | 2021 |
| 50 | Australia | 1,391,251 | 25,422,816 | 5.5 | 1,214,438 | 23,401,890 | 5.2 | +176,813 | 300050 | 2021 |
Source: Australian Bureau of Statistics, Census of Population and Housing (opens a new window) 2016 and 2021. Compiled and presented in atlas.id by .id (opens a new window)(informed decisions).
Compiled and presented in atlas.id by .id (informed decisions)..
Analysis
In 2021, 26.2% of the City of Whitehorse's population nominated Chinese as one of their ancestries compared to 8.3% in Greater Melbourne.
While the City of Whitehorse had a relatively higher proportion of people with Chinese descent, it is important to note that this varied across the City. Proportions ranged from a low of 16.4% in Surrey Hills to a high of 46.6% in Box Hill. The five areas with the highest percentages were:
- Box Hill (46.6%)
- Box Hill North (34.5%)
- Burwood East (30.4%)
- Vermont South (30.1%)
- Forest Hill (26.6%)
Data notes
This data includes all persons who nominated Chinese as one of their ancestries on the Census form. Ancestry is a more subjective measure than birthplace or language but can provide a good indication of the size of particular communities. Please note that individuals may be counted in more than one Ancestry map, since it is a multi-response variable. Percentages are calculated from the total population, not the total responses.